


.png)


Where are the wildfires in Canada? Maps pinpoint the location of fires and air-quality threats from smoke
Since the weekend, several major fires have been raging across Canada’s central and western provinces. The smoke from those fires is now drifting south across the U.S. border and is significantly impacting air quality in several U.S. cities. Here’s what you need to know about the Canadian wildfires and their impact on the United States. What’s happened? Last week, several fires began raging across large portions of Canada, particularly in its central and western provinces, reports CNN. The wildfires are something that happens every year, but in recent years, their range and intensity have grown worse thanks to the drier conditions spurred on by climate change. Data from the Canadian Interagency Forest Fire Centre (CIFFC) shows that as of Monday, June 2, active fires were raging in Canada. Those fires have been classified into four stages of control: 107 are raging “out of control” 26 are said to “being held” 68 are “under control” 7 are “out of control” and being monitored Of the active fires, 74 are in Canada’s westernmost province, British Columbia, which is above the U.S. states of Washington and Montana. The western province of Alberta has the second-highest number of active fires, with 56. Alberta stands above Montana. The central province of Manitoba currently has 25 active fires, followed by Ontario with 19 and Saskatchewan with 16. Saskatchewan, Manitoba, and Ontario span the northern border of the United States from Montana to New York. While the fires’ most disastrous effects are being felt by the Canadian people who live near their epicenters, residents of the United States are also being impacted due to the smoke from the fires drifting into the U.S. Canadian wildfire and smoke impact maps 2025 There are several good mapping resources for those wanting to track the wildfire outbreak and its smoke effects across Canada and the United States. The first map is maintained by the Canadian Interagency Forest Fire Centre (CIFFC). The interactive map displays the active fires that are currently raging in Canada. It color codes the fires based on their stage. There are four stages: Under control (blue): The wildfire is completely contained and will be extinguished. Being held (yellow): Given current weather conditions and resources, the wildfire is not anticipated to grow past expected boundaries. Out of Control (Monitored) (purple): Fires with a monitored response type are being observed and assessed, but not immediately suppressed. As there is no suppression action being taken, these fires are considered out of control until declared out for national reporting purposes. Out of Control (red): The wildfire is burning and is expected to continue growing. The map further displays fires in all four stages based on their size, represented by dots of three different diameters. The smallest dots signify that the fire covers 1 to 100 hectares The medium dot signifies an area of 101 to 1,000 hectares The largest dot signifies an area of greater than 1,000 hectares As the CIFFC’s map shows, some of the largest fires currently burning out of control are in central Canada, though there are several large fires northwest of Winnipeg, just over Montana’s border, that are currently burning out of control. [Screenshot: CIFFC] The second map is provided by AirNow.gov. It displays air quality data from several U.S. government sources, including the Environmental Protection Agency (EPA), National Oceanic and Atmospheric Administration (NOAA), National Park Service, NASA, and the Centers for Disease Control and Prevention (CDC). The AirNow map casts colors across the United States that represent the air quality. Those colors are: Green: good air quality Yellow: moderate Orange: unhealthy for sensitive groups Red: unhealthy Purple: very unhealthy Brown: hazardous The map currently shows that the worst air quality in America is in Minnesota, Wisconsin, Iowa, Illinois, Michigan, and Indiana—the states directly under some of the worst fires in Manitoba and Ontario. [Screenshot: AirNow] Several cities in Minnesota and Wisconsin are under orange “unhealthy for sensitive groups” and red “unhealthy” conditions, including the Duluth and Twin Cities areas of Minnesota, along with Madison and Milwaukee in Wisconsin. However, much of the central eastern and eastern seaboard of the United States, extending all the way to Florida, is also under yellow “moderate” air quality conditions due to the smoke from the Canadian wildfires drifting south. But some better news is on the horizon—at least when it comes to air quality in the United States. AirNow’s map shows that on Wednesday, air quality should improve in the Minnesota and Wisconsin areas, reducing from red “unhealthy” status to orange “unhealthy for sensitive groups” only. Unfortunately for Canada, the country is only at the beginning of its annual wildfire seaso
Since the weekend, several major fires have been raging across Canada’s central and western provinces. The smoke from those fires is now drifting south across the U.S. border and is significantly impacting air quality in several U.S. cities. Here’s what you need to know about the Canadian wildfires and their impact on the United States.
What’s happened?
Last week, several fires began raging across large portions of Canada, particularly in its central and western provinces, reports CNN. The wildfires are something that happens every year, but in recent years, their range and intensity have grown worse thanks to the drier conditions spurred on by climate change.
Data from the Canadian Interagency Forest Fire Centre (CIFFC) shows that as of Monday, June 2, active fires were raging in Canada. Those fires have been classified into four stages of control:
- 107 are raging “out of control”
- 26 are said to “being held”
- 68 are “under control”
- 7 are “out of control” and being monitored
Of the active fires, 74 are in Canada’s westernmost province, British Columbia, which is above the U.S. states of Washington and Montana. The western province of Alberta has the second-highest number of active fires, with 56. Alberta stands above Montana. The central province of Manitoba currently has 25 active fires, followed by Ontario with 19 and Saskatchewan with 16.
Saskatchewan, Manitoba, and Ontario span the northern border of the United States from Montana to New York.
While the fires’ most disastrous effects are being felt by the Canadian people who live near their epicenters, residents of the United States are also being impacted due to the smoke from the fires drifting into the U.S.
Canadian wildfire and smoke impact maps 2025
There are several good mapping resources for those wanting to track the wildfire outbreak and its smoke effects across Canada and the United States.
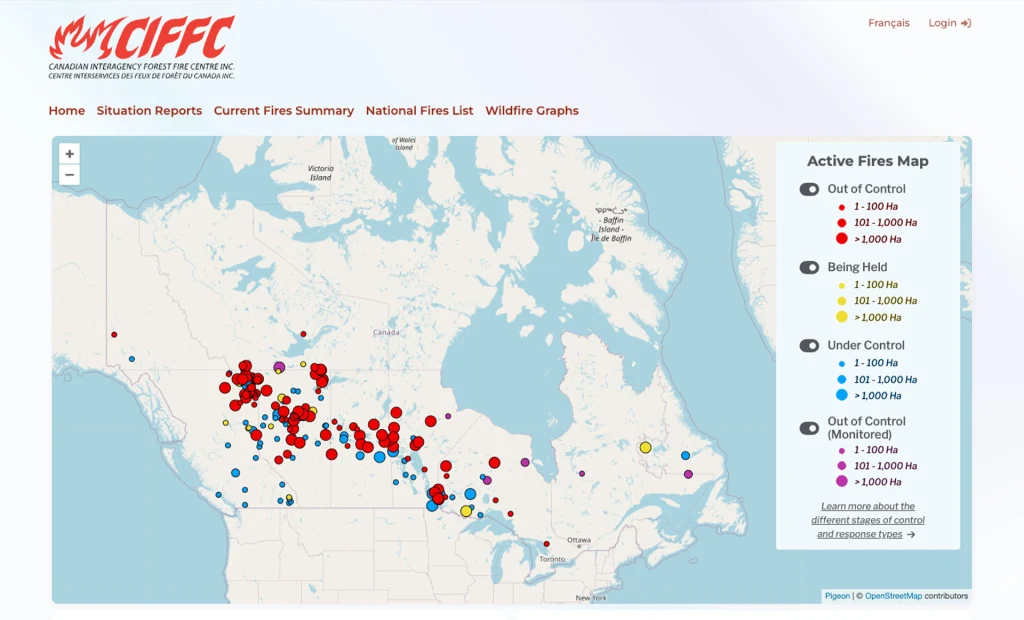
The first map is maintained by the Canadian Interagency Forest Fire Centre (CIFFC). The interactive map displays the active fires that are currently raging in Canada. It color codes the fires based on their stage. There are four stages:
- Under control (blue): The wildfire is completely contained and will be extinguished.
- Being held (yellow): Given current weather conditions and resources, the wildfire is not anticipated to grow past expected boundaries.
- Out of Control (Monitored) (purple): Fires with a monitored response type are being observed and assessed, but not immediately suppressed. As there is no suppression action being taken, these fires are considered out of control until declared out for national reporting purposes.
- Out of Control (red): The wildfire is burning and is expected to continue growing.
The map further displays fires in all four stages based on their size, represented by dots of three different diameters.
- The smallest dots signify that the fire covers 1 to 100 hectares
- The medium dot signifies an area of 101 to 1,000 hectares
- The largest dot signifies an area of greater than 1,000 hectares
As the CIFFC’s map shows, some of the largest fires currently burning out of control are in central Canada, though there are several large fires northwest of Winnipeg, just over Montana’s border, that are currently burning out of control.
The second map is provided by AirNow.gov. It displays air quality data from several U.S. government sources, including the Environmental Protection Agency (EPA), National Oceanic and Atmospheric Administration (NOAA), National Park Service, NASA, and the Centers for Disease Control and Prevention (CDC).
The AirNow map casts colors across the United States that represent the air quality. Those colors are:
- Green: good air quality
- Yellow: moderate
- Orange: unhealthy for sensitive groups
- Red: unhealthy
- Purple: very unhealthy
- Brown: hazardous
The map currently shows that the worst air quality in America is in Minnesota, Wisconsin, Iowa, Illinois, Michigan, and Indiana—the states directly under some of the worst fires in Manitoba and Ontario.
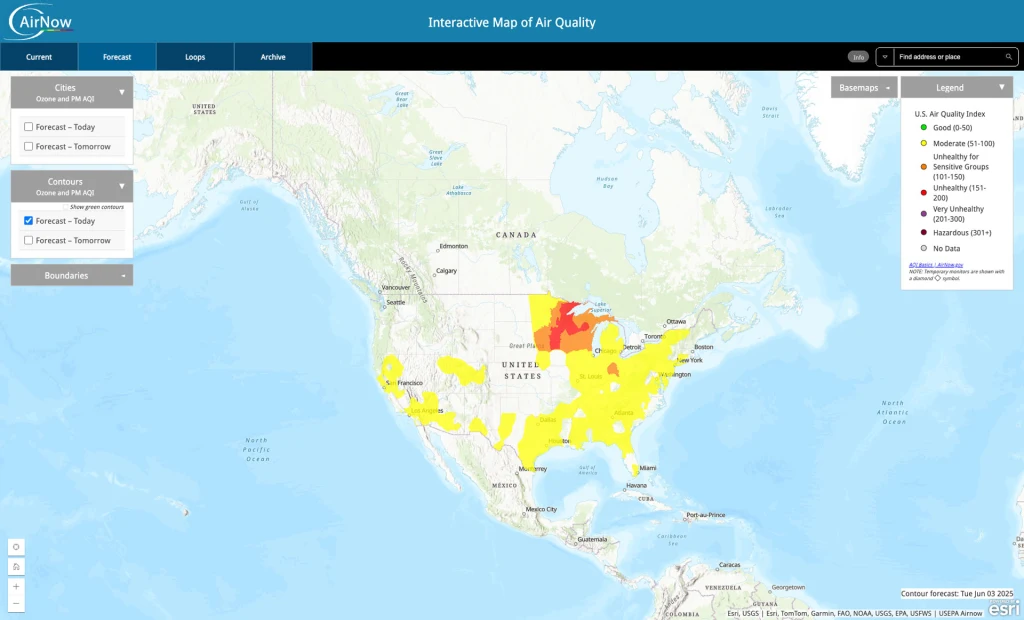
Several cities in Minnesota and Wisconsin are under orange “unhealthy for sensitive groups” and red “unhealthy” conditions, including the Duluth and Twin Cities areas of Minnesota, along with Madison and Milwaukee in Wisconsin.
However, much of the central eastern and eastern seaboard of the United States, extending all the way to Florida, is also under yellow “moderate” air quality conditions due to the smoke from the Canadian wildfires drifting south.
But some better news is on the horizon—at least when it comes to air quality in the United States.
AirNow’s map shows that on Wednesday, air quality should improve in the Minnesota and Wisconsin areas, reducing from red “unhealthy” status to orange “unhealthy for sensitive groups” only.
Unfortunately for Canada, the country is only at the beginning of its annual wildfire season. Already, the nation is at a National Preparedness Level (NPL) of five—the highest possible and one in which “full commitment of national resources is ongoing” to support fighting the fires.
As noted by CNN, Canada did not reach the NPL level of five last year until July 15. This year, it reached that level on May 28.