![The Largest Communities on Reddit [Infographic]](https://imgproxy.divecdn.com/vfTS-YsC_ZrqM6F4tAXJgV6qj3gCHSsf2dvHufDbrrQ/g:ce/rs:fit:770:435/Z3M6Ly9kaXZlc2l0ZS1zdG9yYWdlL2RpdmVpbWFnZS9sYXJnZXN0X3JlZGRpdF9jb21tdW5pdGllczIucG5n.webp)


![[Weekly funding roundup June 14-20] VC inflow crashes to second lowest level for the year](https://images.yourstory.com/cs/2/220356402d6d11e9aa979329348d4c3e/WeeklyFundingRoundupNewLogo1-1739546168054.jpg)


Dogecoin Rebounds From 16 Cents as Triangle Pattern Signals 60% Price Swing
DOGE forms a tight consolidation pattern with a triangle setup hinting at a 60% price swing.
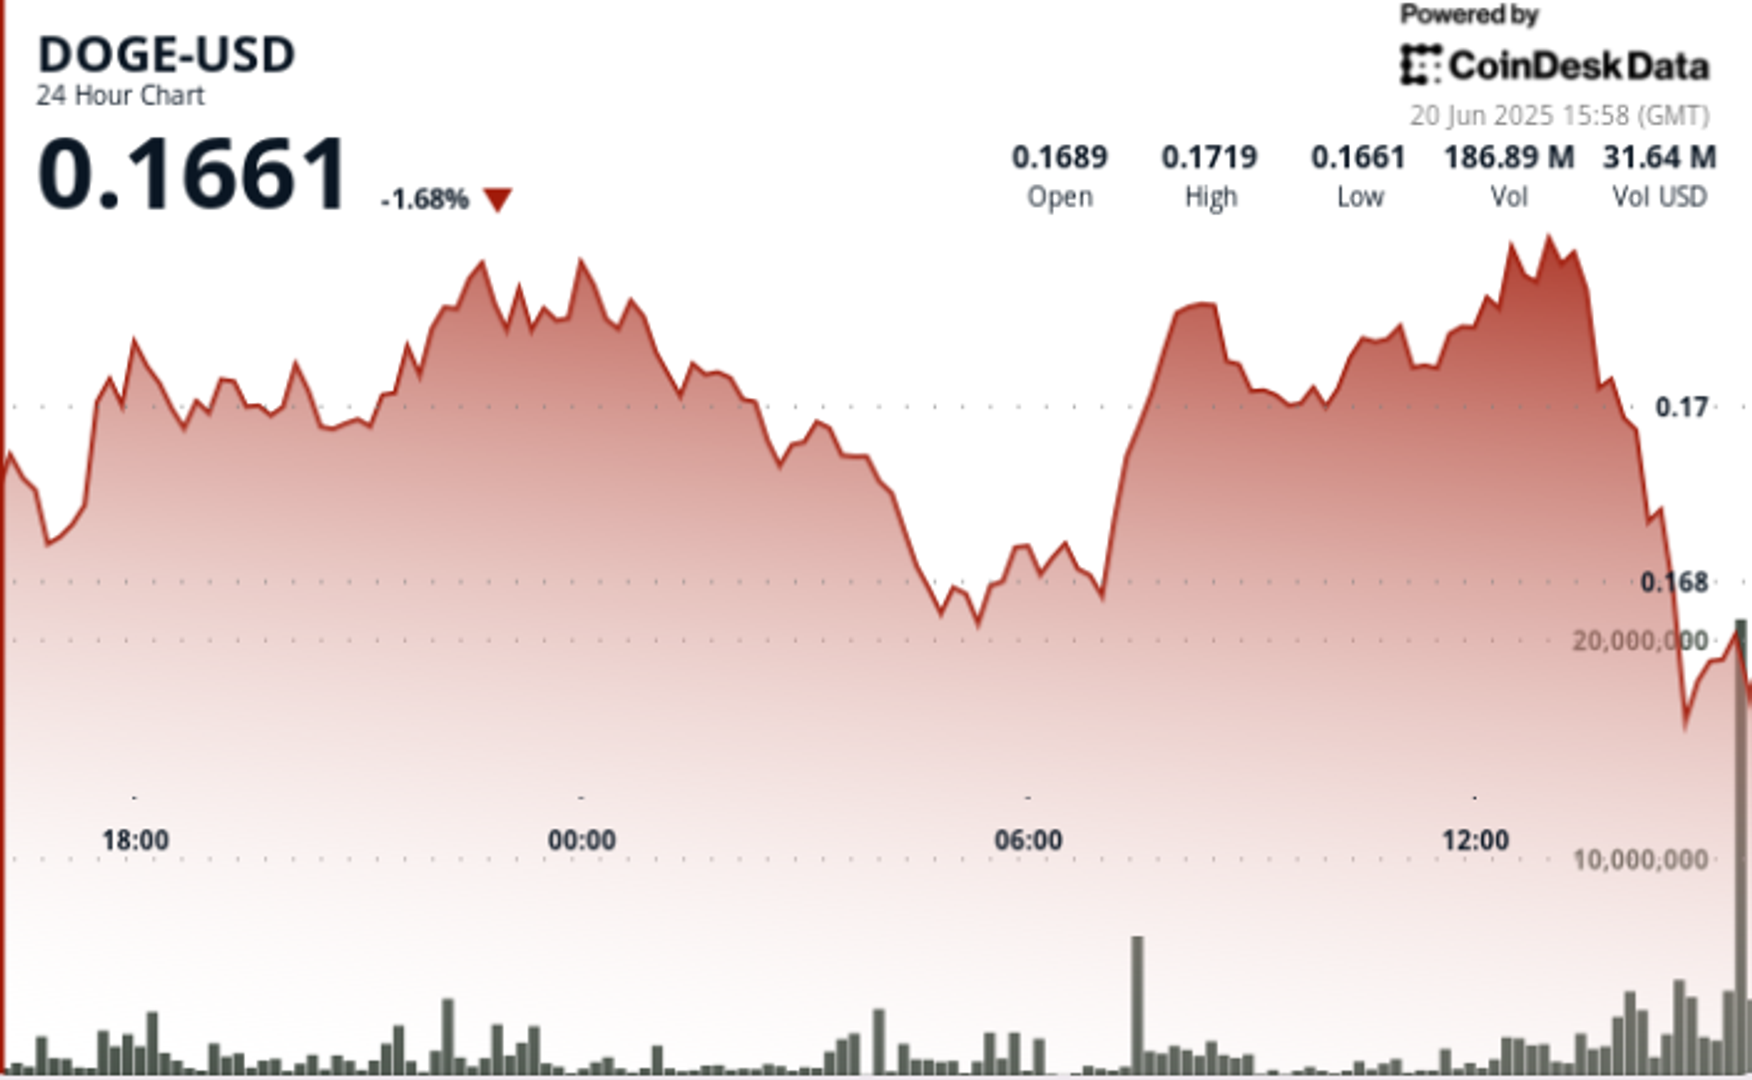
Dogecoin is stabilizing near $0.170 after a sharp reversal from session lows, showing signs of accumulation as macroeconomic tensions rattle global markets.
The meme cryptocurrency found strong support at $0.16, and is now coiling within a symmetrical triangle — a technical pattern known to precede major directional moves.
News Background
- Analysts are increasingly focused on DOGE’s tightening technical structure. The current symmetrical triangle setup, combined with compressing volume and narrowing volatility, suggests a breakout could be imminent.
- Historical precedence for this pattern points to a potential 60% price move — though the direction remains unclear.
- As the Federal Reserve prepares to issue its next policy guidance and risk assets remain under pressure, DOGE’s positioning near a breakout point could present opportunity — or risk — for traders betting on a resolution.
Price Action
DOGE traded within a 2.7% range between $0.167 and $0.172 over the 24-hour period. A sharp 1.8% drop at 04:00 was followed by a strong recovery during the 07:00 hour, where volume spiked to 248 million units — the day’s highest. That rebound solidified $0.168 as a key support level.
Price action then entered a consolidation phase between $0.170 and $0.172. Attempts to break above resistance at $0.172 were rejected during the 13:00 hour, with 193 million in selling volume. Downward pressure re-emerged around 13:45–13:51, when volume spiked again to 18.7 million, but DOGE held its ground at $0.170.
Technical Analysis Recap
- DOGE posted a 2.7% 24-hour range, trading from $0.167 to $0.172.
- Sharp 1.8% decline early in session was reversed with 248M volume at $0.168 — now confirmed as support.
- Consolidation range established between $0.170–$0.172.
- Resistance tested and rejected at $0.172 during high-volume 13:00 hour (193M).
- Late-session dip saw volume surge to 18.7M; price defended $0.170 floor.
- Symmetrical triangle pattern tightening, with analysts calling for potential 60% move on breakout.
- RSI hovering near 50; MACD flattened — momentum indicators reflect compression phase.