The Solar Cycle(s): history, data analysis and trend forecasting.
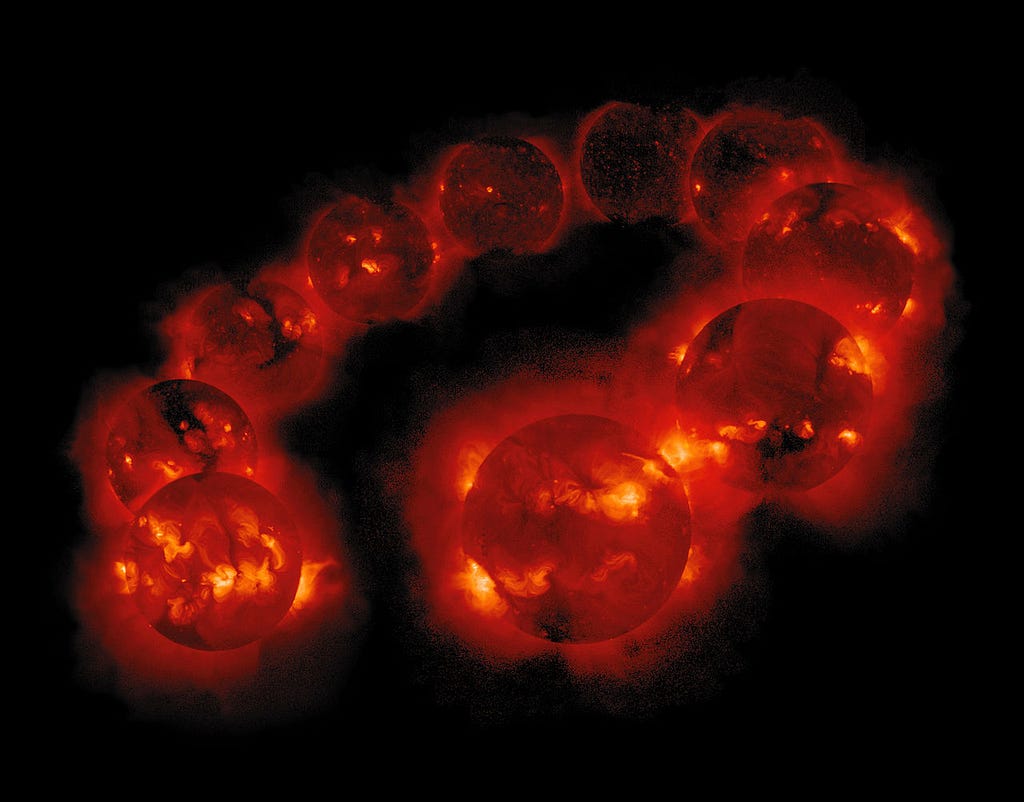
The Solar Cycle(s): History, Data Analysis and Trend ForecastingA brief article on the Solar Cycles, the history behind their observation, data analysis and time series forecasting for the incoming solar maximum in 2025–2026 and the next decadesYou have probably heard about the 11-year Solar Cycle and about solar maximums and minimums at some point in your life — every 11 years, solar activity peaks, with more auroras in the poles and more noise to electronic devices. This is the period where Solar Storms also appear, and when the sunspots also show up.Well, as things usually are in physics, it is not that simple.A solar cycle: a montage of ten years’ worth of Yohkoh SXT images, demonstrating the variation in solar activity during a solar cycle, from after August 30, 1991, to September 6, 2001. Credit: the Yohkoh mission of ISAS (Japan) and NASA (US). Image under the CC0 1.0 license, dedicated to the public domain (source).When it comes to Space, the Solar Cycle (and in general, seasonality and patterns in nature) has always been one of my fascinations. Its behavior is far from the simple 11-year periodicity that we might have heard of: it is incredibly more complex than that. Multiple combined cycles are believed to be taking place, some of them spanning centuries or even millennia. Of course, these kinds of observations and modelling only use indirect information and lay more on the descriptive side. To be able to generate an explicative model would require scientists to fully understand the distribution and mechanics of the core of our star, and there is still work to be done. In the meantime, we will keep on studying these secondary phenomena, such as sunspots, SPE, solar X-ray activity and UV readings, and collecting and analyzing the data that is available to us.This article aims to cover the background and history of solar observation, overview current methods and models, perform data analysis and model fittings on a publicly available (NOAA’s Solar Flare Index) dataset, and forecast future trends.The history of solar observationThe oldest eclipse records found date back to 1223 BCE, in Ugarit (now Syria), written down on a clay tablet. From that onwards, ancient Babylonians seem to have kept track of eclipses, even going as far as being able to predict them [1,6]. Sunspots were first observed around 800 BCE, both by Babylonians and the Chinese. These records were taken on command of the emperors and noted some “darkenings” or “obscurate” patches in the Sun [1,6]. Five centuries later, similar readings were made by the Greek scholar Theophrastus [2].During the Middle Ages, more and more observations were taken note of. Aldemus, in the year 807 CE, thought he was seeing Mercury pass in front of the Sun, but it was later found to be a notably large sunspot. He wasn’t the only one, since in the coming years, more incorrect attributions to planets in transit took place [3]. Observations of the solar corona and of solar flares or CMEs happened, respectively, in the year 968 and in 1185, both during a solar eclipse [4,6].During the Modern Era, Thomas Harriot, in 1610, was the first to observe sunspots with a telescope, with Johann Goldsmith confirming his sightings just a year later [5,6]. They both paved the way for Galileo Galilei, who claimed three years later that the sunspots were surface features of the Sun, and not planets or other celestial bodies [6]. The studies were slowed down by what we know of the Maunder Minimum, a period of low solar activity, with very few sunspots and CMEs.A drawing of a sunspot in the Chronicles of John of Worcester, ca. 1100. Image from the public domain (source).In the early XIXth century, radiation (IR and UV) readings from the sun started being recorded, and solar spectrometry was born. Samuel Heinrich Schwabe was the first to theorize about a “ten-year Solar Cycle” based on sunspot activity. Gustav Spörer claimed that the cycle lasted around 70 years, attempting to explain the Maunder Minimum. Rudolf Wolf studied the past sunspot data and attempted to collect historical records for later studies. Later, independent researchers found a connection between this cycle and magnetic activity on Earth, becoming the first research into Earth-Sun interactions. [7]During the XXth century, many solar observatories were built around the world, specializing in certain areas of the sun. Also, many satellites and probes have been launched to study solar activity. The f10.7 index (radio emissions of wavelength of 10.7cm) has been incredibly useful for solar activity recording. Other, more modern methods of indirect observation include looking into geology (rock formations, layering and magnetization) or carbon-14 decay in tree rings or ice sheets [8].From then on, various independent scientists have been trying to predict solar activity and the behaviour of the “Solar Cycle”. There exist claims as different as saying that the 25th Cycle might not happen at all (NSO) [9], or that it
The Solar Cycle(s): History, Data Analysis and Trend Forecasting
A brief article on the Solar Cycles, the history behind their observation, data analysis and time series forecasting for the incoming solar maximum in 2025–2026 and the next decades
You have probably heard about the 11-year Solar Cycle and about solar maximums and minimums at some point in your life — every 11 years, solar activity peaks, with more auroras in the poles and more noise to electronic devices. This is the period where Solar Storms also appear, and when the sunspots also show up.
Well, as things usually are in physics, it is not that simple.
When it comes to Space, the Solar Cycle (and in general, seasonality and patterns in nature) has always been one of my fascinations. Its behavior is far from the simple 11-year periodicity that we might have heard of: it is incredibly more complex than that. Multiple combined cycles are believed to be taking place, some of them spanning centuries or even millennia. Of course, these kinds of observations and modelling only use indirect information and lay more on the descriptive side. To be able to generate an explicative model would require scientists to fully understand the distribution and mechanics of the core of our star, and there is still work to be done. In the meantime, we will keep on studying these secondary phenomena, such as sunspots, SPE, solar X-ray activity and UV readings, and collecting and analyzing the data that is available to us.
This article aims to cover the background and history of solar observation, overview current methods and models, perform data analysis and model fittings on a publicly available (NOAA’s Solar Flare Index) dataset, and forecast future trends.
The history of solar observation
The oldest eclipse records found date back to 1223 BCE, in Ugarit (now Syria), written down on a clay tablet. From that onwards, ancient Babylonians seem to have kept track of eclipses, even going as far as being able to predict them [1,6]. Sunspots were first observed around 800 BCE, both by Babylonians and the Chinese. These records were taken on command of the emperors and noted some “darkenings” or “obscurate” patches in the Sun [1,6]. Five centuries later, similar readings were made by the Greek scholar Theophrastus [2].
During the Middle Ages, more and more observations were taken note of. Aldemus, in the year 807 CE, thought he was seeing Mercury pass in front of the Sun, but it was later found to be a notably large sunspot. He wasn’t the only one, since in the coming years, more incorrect attributions to planets in transit took place [3]. Observations of the solar corona and of solar flares or CMEs happened, respectively, in the year 968 and in 1185, both during a solar eclipse [4,6].
During the Modern Era, Thomas Harriot, in 1610, was the first to observe sunspots with a telescope, with Johann Goldsmith confirming his sightings just a year later [5,6]. They both paved the way for Galileo Galilei, who claimed three years later that the sunspots were surface features of the Sun, and not planets or other celestial bodies [6]. The studies were slowed down by what we know of the Maunder Minimum, a period of low solar activity, with very few sunspots and CMEs.
In the early XIXth century, radiation (IR and UV) readings from the sun started being recorded, and solar spectrometry was born. Samuel Heinrich Schwabe was the first to theorize about a “ten-year Solar Cycle” based on sunspot activity. Gustav Spörer claimed that the cycle lasted around 70 years, attempting to explain the Maunder Minimum. Rudolf Wolf studied the past sunspot data and attempted to collect historical records for later studies. Later, independent researchers found a connection between this cycle and magnetic activity on Earth, becoming the first research into Earth-Sun interactions. [7]
During the XXth century, many solar observatories were built around the world, specializing in certain areas of the sun. Also, many satellites and probes have been launched to study solar activity. The f10.7 index (radio emissions of wavelength of 10.7cm) has been incredibly useful for solar activity recording. Other, more modern methods of indirect observation include looking into geology (rock formations, layering and magnetization) or carbon-14 decay in tree rings or ice sheets [8].
From then on, various independent scientists have been trying to predict solar activity and the behaviour of the “Solar Cycle”. There exist claims as different as saying that the 25th Cycle might not happen at all (NSO) [9], or that it will have the same intensity as Cycle24 [10] (NOAA).
State of the art
NASA’s “Space Place” defines the Solar Cycle as “the cycle that the Sun’s magnetic field goes through approximately every 11 years. […] the Sun’s magnetic field completely flips. […] (the Solar Cycle) affects activity on the surface of the Sun, such as sunspots […]” [11]. There is, later again in the text, emphasis on the “approximation” of this 11-year period. And why is that?
Every eleven years, approximately, the Sun’s magnetic field completely flips — North goes to South and viceversa — causing heightened activity in the star’s surface, such as solar storms and coronal mass ejections.
The most recent studies [12] have determined that the Sun Cycle length has remained the same for at least 700 million years: around 10.62–11 years per flip. Still, many factors of this said cycle are still unknown to us: for example, a study in 2009 revealed that a very short cycle (less than 8 years) had taken place in the XVIIIth century, completely shaking up the feeling of stability and predictability that had reigned before [13]. Simply overviewing the historical records, one can see that said cycle is far from constant.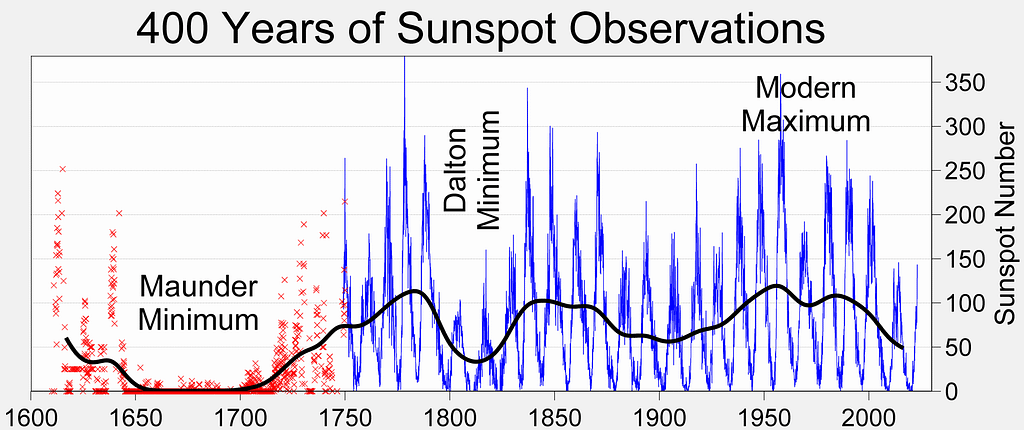
Plenty of effects and modulating patterns have been theorized, trying to describe all these irregularities. As a summary:
- Waldeimer effect: Term coined after Max Waldeimer, who observed that the cycles’ maximum amplitude and the time between minimum and maximum are inversely proportional. So, the more “aggressive” and “violent” cycles also happen faster [14].
- Gleissberg cycle: it describes a broader, slower cycle of 70–100 years (so every seven or eight cycles) that modulates the activity of the 11-year cycles. This correlates well enough with data from carbon-14, used for the periods of time when there were no regular, systematic human observations taking place [8].
- Suess-de Vries cycle: this overarching cycle has only been observed in radiocarbon proxies (not by direct observation of sun-phenomena) and has a period of around 210 years. Still, since we only have 400 years of sunspot records, there isn’t still a correlation significant enough to validate it [8].
And this is where things get interesting. Larger, longer cycles could exist, but there are simply not enough records to confirm or deny their existence. Also, the composition and modulation of these effects, one on top of another, makes describing and modelling the solar cycle orders of magnitude more complex.
Data Analysis: NOAA database
For this section, we will be using the data from the sun flare index from the National Centers for Environmental Information (formerly the National Oceanic and Atmospheric Administration). The repository links and data folders, as well as all files, can be found in Annex I. As a quick side note, I would not recommend using this data directory as is, since the state of it was well below standards. I have curated and properly formatted the dataset in my GitHub repository, as well as uploaded all the source code and data. More information on this in Annex I.
The Flare Index Data used in this study was calculated by T. Atac and A. Ozguc from Bogazici University Kandilli Observatory, Istanbul, Turkey. They have done an amazing job at recording this invaluable information, and if it weren’t for them, these kinds of data analysis and forecasts could not be performed.
The Solar Flare Index (SFI) is a measure containing information from several solar and atmospheric readings, as the F10.7 index, H-alpha flare importance, 200MHz flux, and sudden ionospheric disturbances, among others. It’s an excellent indicator of solar activity.
We will start the study by displaying data on a daily, monthly, and yearly basis. These averages will allow us to see the unpredictability but also the periodicity of the Sun Cycles.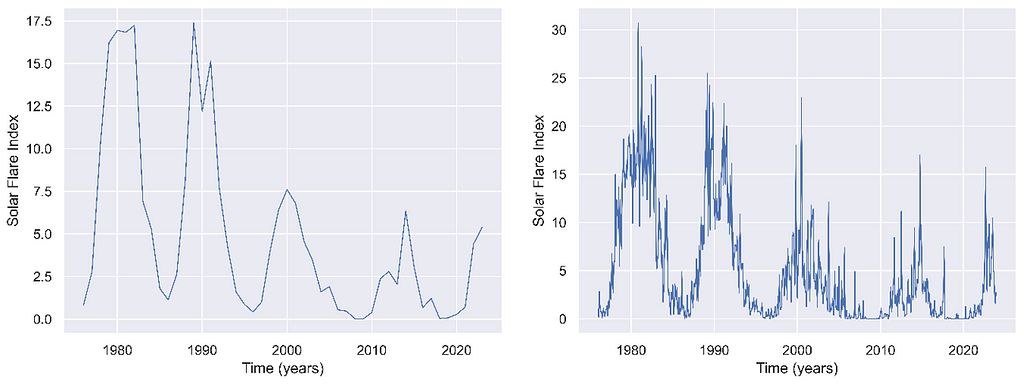
And here is a full resolution visualization of the most fine-grained data available: the daily SFI records. I have also plotted the monthly data, in orange, as well as the plus-minus one sigma ranges (CI of 65%), with green (upper) and red (lower), calculating the variance monthly. This shows just how unpredictable these high energy peaks are.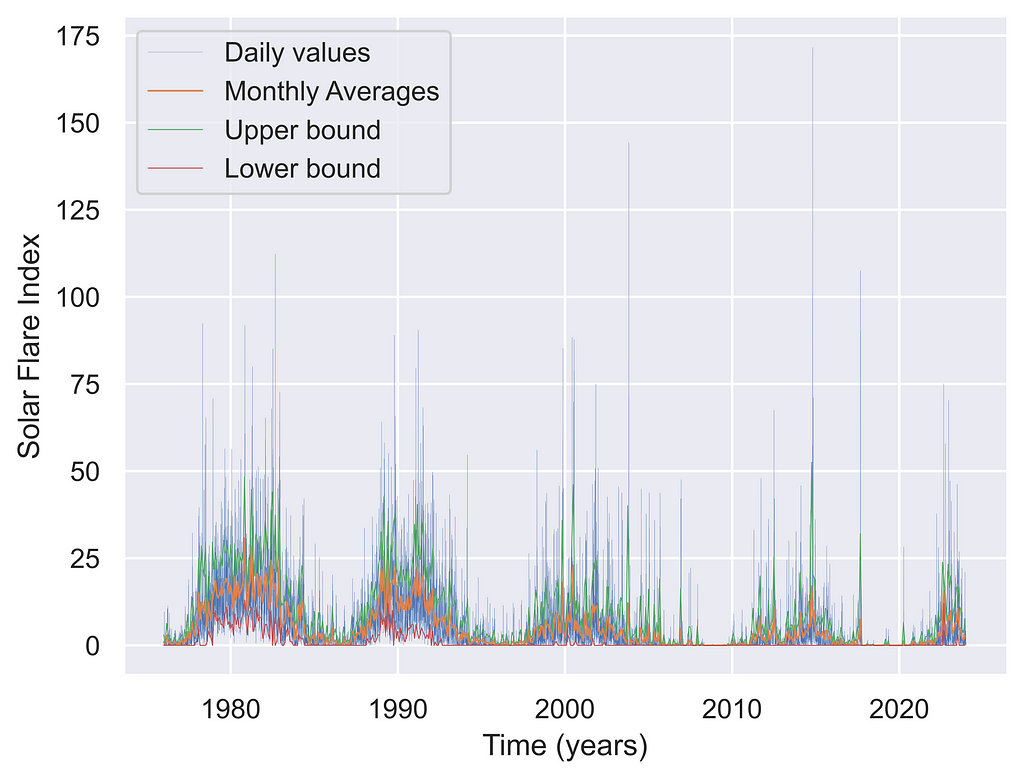
Just by overviewing these plots, we can see the unpredictability that was described in the former sections. While the monthly average values don’t ever exceed SFI values of 30–32, the daily values can reach up to the 160s, more than five times higher. These high-energy events usually duplicate or triplicate the upper +1 sigma bound, exemplifying well how complicated they are to predict.
Predicting Cycles 25 and 26. Time series forecasting.
Now, a time series data analysis would not be complete without some predictions and forecasting. We will use two methods for it: a SARIMA model and a compounded sinusoidal mathematical model.
The SARIMA model consists of the joint usage of an Auto-Regressive model, a Moving Average model, differentiation, and Seasonality. It is crucial that we use a SARIMA instead of an ARMA-ARIMA model, because (see Annex II) a model that doesn’t consider seasonality will very likely not be able to properly represent cyclic behavior (like that of the Sun’s Cycle).
We have chosen a p=d=q=1, P=D=Q=1, s=12*11 as an initial guess. The AR and MA values are standard for time-series forecasting, and the seasonality factor was set to 12*11 (132 months, or eleven years), since we will be predicting values monthly. We also decided to differentiate once, in hopes of focusing on the variation between months instead of the actual SFI values per month. The resulting model, trained on 576 observations, had a log-likelihood value of -1223.6 and predicted the following years’ activity realistically.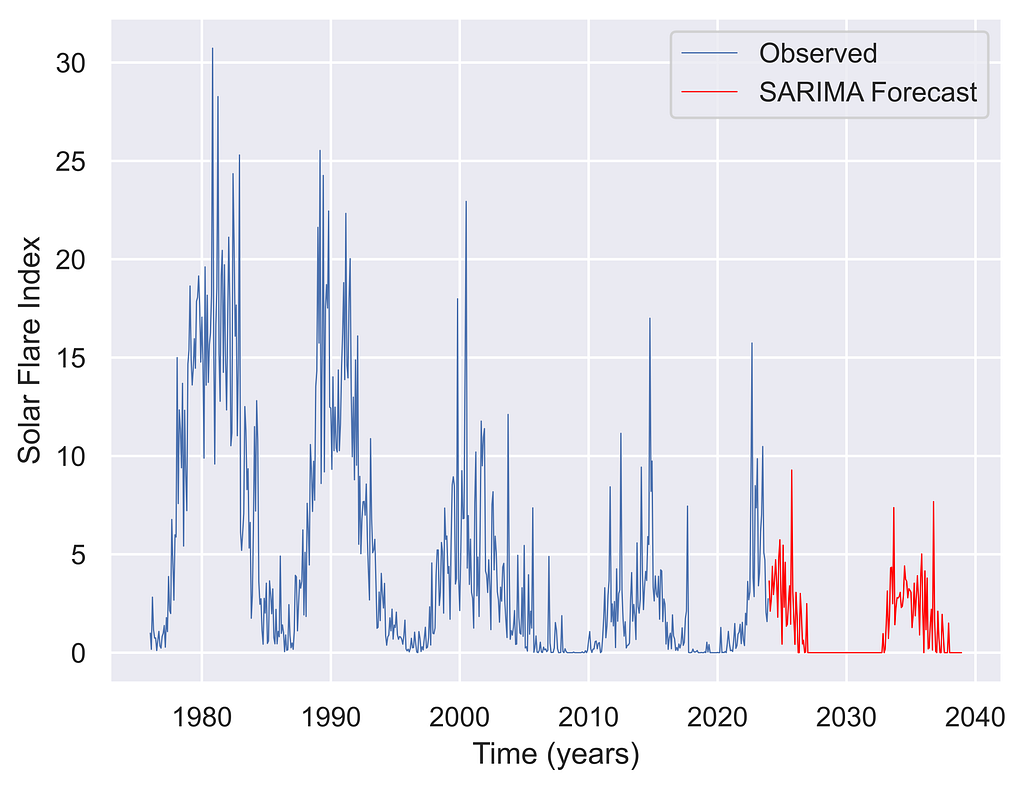
We see a prediction similar to NOAA’s claims [10], which is that Cycle 25 will be very similar to Cycle 24. The model dared to also predict some peaks, portraying C25 as a double peaked cycle. Cycle 26 predictions seem conservative enough, with a wide minimum around the years 2027–2033.
Now, we also decided to construct a mathematical model utilizing a composition of sinusoidal waves. We decided to fit parameters for both the 11-year cycle and Gleissberg’s 70–100 year cycle, which we set to a period of 8 cycles (88 years). The results, while not showing any peaks, are satisfactory, and could model well the yearly averaged SFI values for the forthcoming years.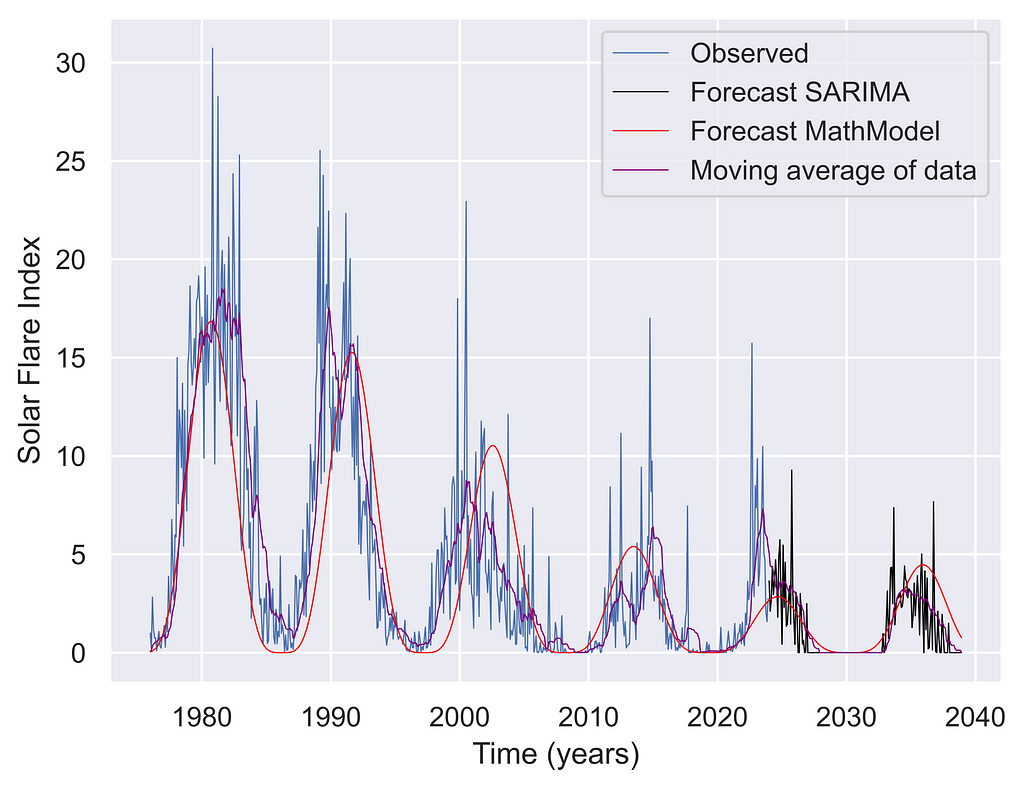
This model predicts a slight rise for Cycle 26 and a quiet Cycle 25. It also agrees with NOAA’s [10] opinion but does steer more towards NSO’s prediction. It was very interesting to generate this model, because with a simple product of sinusoids, we were able to perceive some effects in the peak’s time of appearance. The modulation of Gleissberg’s cycle shifted some of the peaks slightly forwards and backwards, which could be a way to explain some of the shortened or elongated cycles experienced in the past. The equation for it is as follows:
While the function is not simplified at all, I’ve written it this way to be able to show most parameters and how they interact with eachother. At its core, is a product of two cosines, the left one (squared) corresponding to the smaller cycle and the other one to Gleissberg’s, that stands above the horizontal axis (SFI values can’t be negative).
Conclusions
I believe we have been able to, even if briefly, cover most of the history and current investigation lines regarding the Solar Cycle. In this article we have also taken time to explore the data ourselves, investigate and make some future predictions on the Sun’s activity for the following decades.
Studying the variability and unpredictability of the SF index was fascinating, and being able to represent data grouped by different time scales allowed us to both understand the underlying trend and the quick variations of the phenomena.
The status of the dataset, unfortunately, was very poor. The data itself, provided by NOAA and Kandilli Observatory, is precious and given with extreme detail and accuracy. Still, it is regrettable that it is provided in such a substandard shape and formatting. Luckily, this did not stop us from conducting the study, and we were able to provide a clean dataset for future users to utilize in their investigations.
We were able to make some predictions using several time-series models. The ARMA proved unsuccessful (see Annex II), but SARIMA yielded exciting results, agreeing with renowned institutions in the field. We were also able to theorize a mathematical model to represent the cycle’s long scale fluctuations with success.
As we mentioned at the beginning of the article, these predictions and models are based on indirect measurements, and not actually describing the internal movements of the Sun’s core and magnetic field. For us to be able to make predictions with confidence, we would need to mathematically model those fluid interactions in the star’s nucleus as well as corona, which is extremely complex as of today.
References
[1] High Altitude Observatory (NCAR) education webpage https://web.archive.org/web/20140818180023/http://www.hao.ucar.edu/education/TimelineA.php
[2] J. British Astronomical Association (SAO-NASA-ADS), letter to the editor regarding Theophrastus’ observations https://adsabs.harvard.edu/full/2007JBAA..117..346V
[3] Wilson ER (1917). “A Few Pre-Copernican Astronomers”. Popular Astronomy. 25: 88.
[4] High Altitude Observatory (NCAR) education webpage https://web.archive.org/web/20140818180026/http://www.hao.ucar.edu/education/TimelineB.php
[5] Sunspot Positions and Areas from Observations by Thomas Harriot, Springer Nature https://link.springer.com/article/10.1007/s11207-020-01604-4
[6] High Altitude Observatory (NCAR), Great Moments in the History of Solar Physics https://web.archive.org/web/20060301083022/http://web.hao.ucar.edu/public/education/sp/great_moments.html
[7] High Altitude Observatory (NCAR) education webpage https://web.archive.org/web/20140818180035/http://www.hao.ucar.edu/education/TimelineD.php
[8] The Solar Cycle, David H. Hathaway, Springer Nature. https://link.springer.com/article/10.12942/lrsp-2010-1
[9] Commentary by NSO regarding upcoming reduced solar activity. https://web.archive.org/web/20150802025816/http://www.boulder.swri.edu/~deforest/SPD-sunspot-release/SPD_solar_cycle_release.txt
[10] NOAA’s Cycle-25 preliminary forecast, from 2019. https://www.swpc.noaa.gov/news/solar-cycle-25-preliminary-forecast
[11] NASA’s “Space Place” educational page https://spaceplace.nasa.gov/solar-cycles/en/
[12] NewScientist article by Michael Marshall https://www.newscientist.com/article/2176487-rock-layers-show-our-sun-has-been-in-same-cycle-for-700-million-years/
[13] Arxiv Astrophysics article by Usoskin et al, lost Cycle https://arxiv.org/abs/0907.0063
[14] Chinese J. of Astronomy and Astrophysics, “The Relation between the Amplitude and the Period of Solar Cycles” https://iopscience.iop.org/article/10.1088/1009-9271/6/4/12
Annex I
Brief commentary on the status of the Flare Index Dataset (NOAA), Kandilli Observatory.
The dataset status is not satisfactory. It is hard and painfully slow to navigate (considered programming and using a webscraper, but ended up downloading files from 1976 to 2023 manually which took around an hour). The formatting is extremely inconsistent. In my repo, I analyze in more detail these problems.
I would like to remark that having access to precious data like this is extremely helpful for research, and that by no means I’m trying to disregard or undermine the work done by Kandil Observatory and Bogazici University. I do believe, though, that it is a pity that such accurate and important data as this has become complicated to utilize due to poor maintenance.
In this repository I share a python script which is able to clean up and reformat the data. Feel free to use it or tweak it if needed.
GitHub repository with code and clean dataset
[A1] https://github.com/Nerocraft4/SolarCycleStudySFI
Dataset references
[A2] Dataset Source: https://www.ngdc.noaa.gov/stp/space-weather/solar-data/solar-features/solar-flares/index/flare-index/
[A3] Dataset Documentation and Licensing: https://www.ngdc.noaa.gov/stp/space-weather/solar-data/solar-features/solar-flares/index/flare-index/documentation/dataset-discription_flare-index.pdf
[A4] Dataset Calculations: https://www.ngdc.noaa.gov/stp/space-weather/solar-data/solar-features/solar-flares/index/flare-index/documentation/solar-physics_atac-ozguc.pdf
Final comment on ARMA models
In the repository, an extended annex II is added to discuss why the ARMA/ARIMA models were unsuccessful here. I’m not adding it to the article due to verbosity / extension reasons.
The Solar Cycle(s): history, data analysis and trend forecasting. was originally published in Towards Data Science on Medium, where people are continuing the conversation by highlighting and responding to this story.
What's Your Reaction?



_Vladimir_Stanisic_Alamy.jpg?#)




![Kicked Out Of His Seat—Delta Passenger Forced To Move For A Dog [Roundup]](https://viewfromthewing.com/wp-content/uploads/2024/12/delta_dog_in_bulkhead-transformed.jpg?#)


